Preface
Douban Movie provides the latest film introductions and reviews, as well as showtimes and ticket-buying services for current releases. You can log what you want to watch, are watching, or have already watched — rate films, write reviews — all of which makes choosing what to see much easier.
Douban Movie describes itself this way: “China’s most authoritative film ratings and great reviews, real viewing impressions from millions of moviegoers — helping you decide what to watch.” And it genuinely lives up to that description.
Recently, though, a piece of news set social media ablaze. On December 27, the China Film News published an article titled “Douban Movie Ratings Face a Crisis of Credibility,” which was subsequently reposted by the People’s Daily app with the headline: “Douban and Maoyan Movie Ratings Face Credibility Crisis; Malicious Reviews Are Harming the Film Industry.”
With that as backdrop, I decided to dust off some previously scraped Douban movie data and do a proper analysis — focusing especially on comparing Chinese films with those from other countries and regions, in order to set the record straight on Douban ratings.
Dataset Overview
This dataset was scraped through the first half of 2016 and contains 58,127 films in total. Fields include: ID, title, Douban rating, number of raters, release date, director, cast, country of production, and synopsis. Sorted by number of raters (descending), a screenshot of the database looks like this:
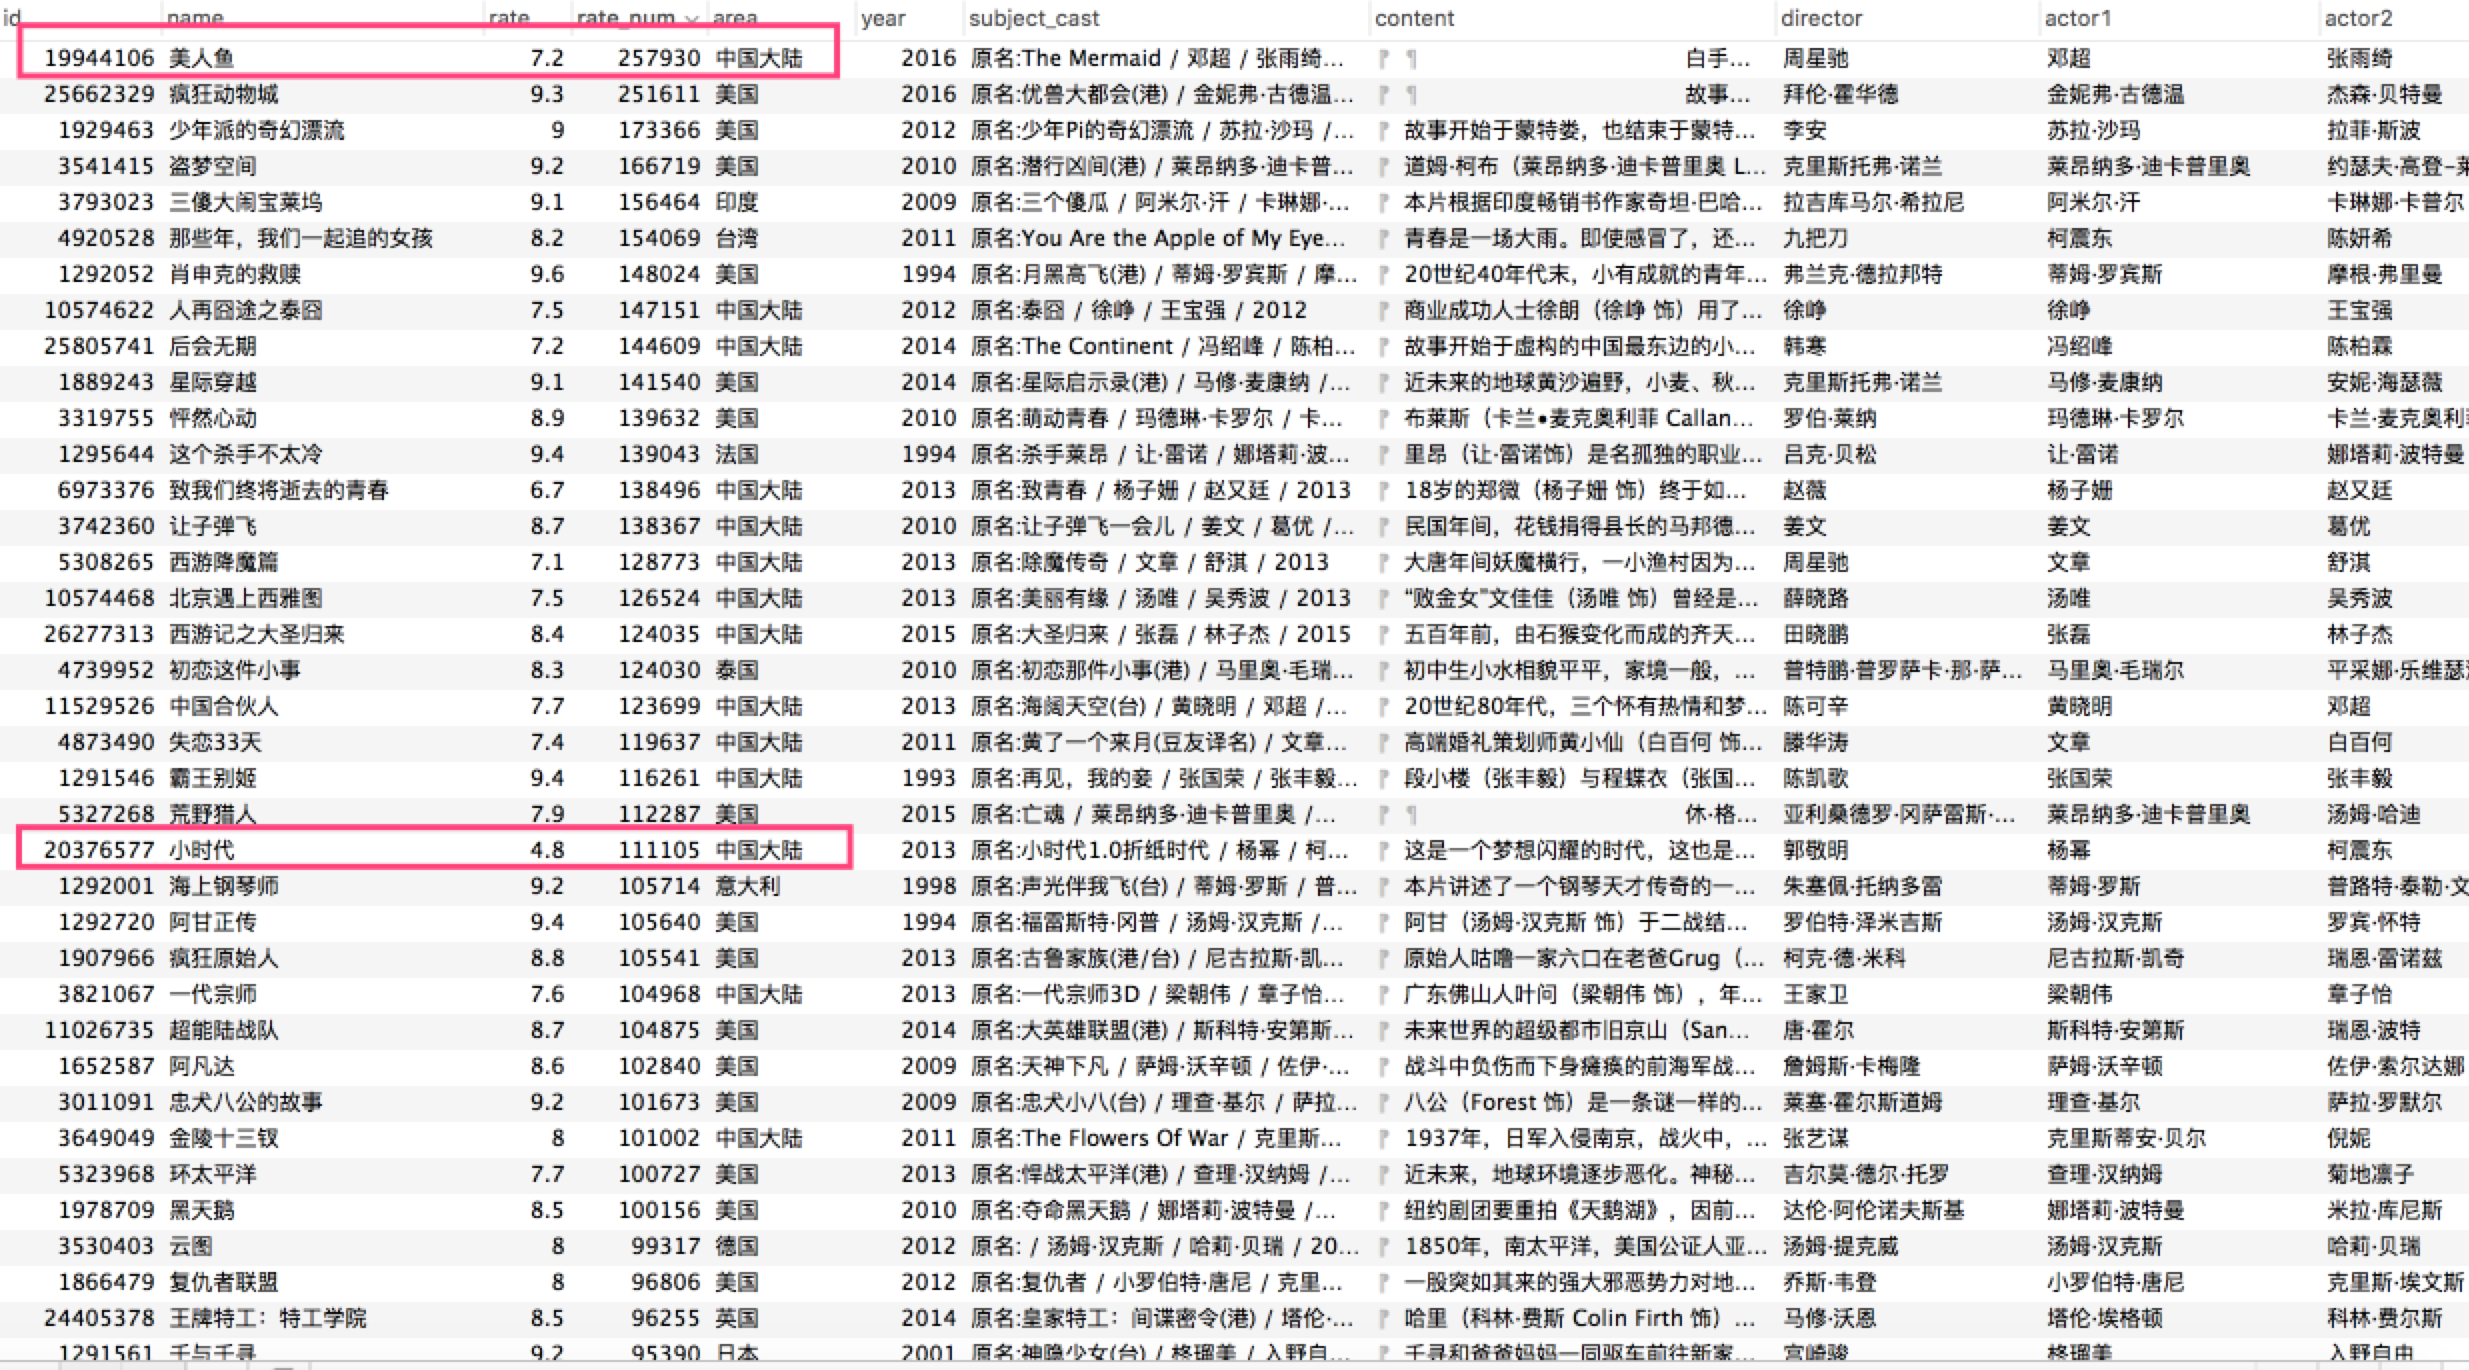
Notably, the film with the most ratings is Stephen Chow’s The Mermaid — a domestic production — demonstrating that Chinese audiences do care about domestic films, contrary to what the People’s Daily piece implied about Chinese audiences favoring foreign movies.
It’s also worth noting that among the most-rated films, scores tend to cluster at 7.0 and above, indicating that high-engagement films are generally decent. (Tiny Times being the obvious exception.)
Film Quality Analysis by Country
Douban’s lowest rating is one star, which translates to 2.0 points, so the theoretical minimum on Douban is 2.0 rather than 0.
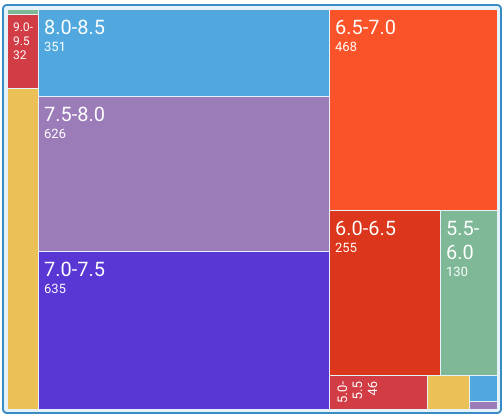
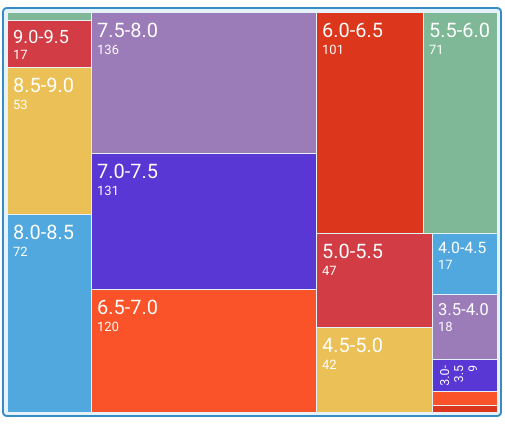
Because there are many countries and pie charts would be cluttered, I used Treemaps to show the rating distributions for each country.
I selected the 15 countries and regions with the highest output for analysis.
United States
Total films: 16,773
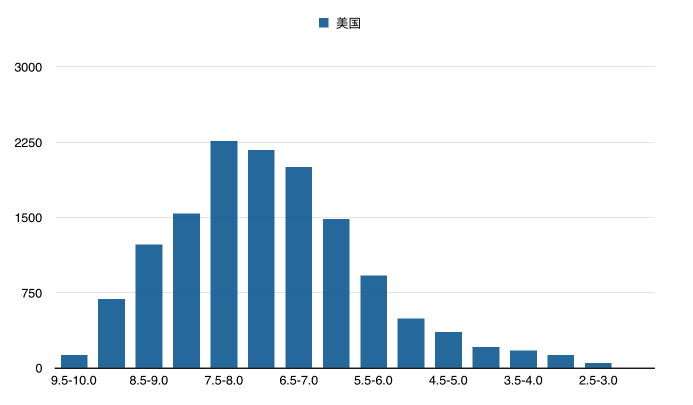
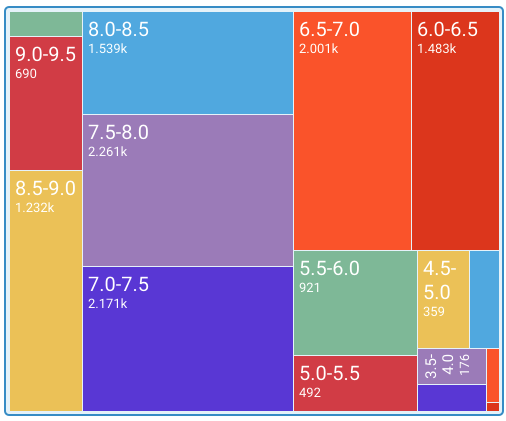
The US produces the most films, but also the most bad ones — the distribution follows a fairly standard normal curve.
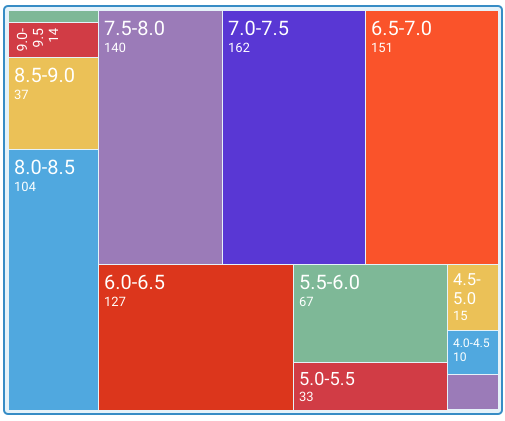
Mainland China
Total films: 7,516

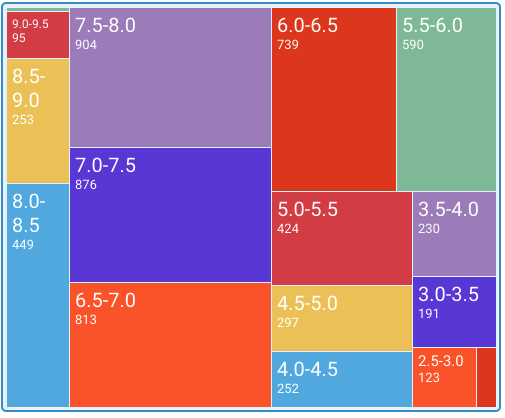
China also produces a large volume of films, but the proportion of bad films is even higher, and good films are rare. There is a conspicuous gap in the 8-point range.
Japan
Total films: 8,598
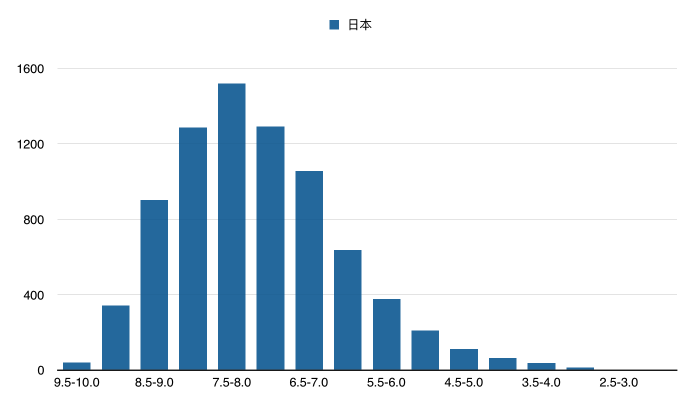

Japan’s normal distribution is shifted to the left, indicating overall higher film quality.
United Kingdom
Total films: 3,667


France
Total films: 3,210

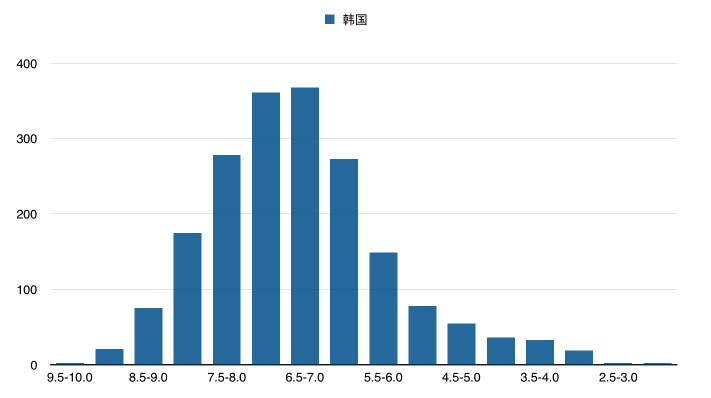
South Korea
Total films: 2,126

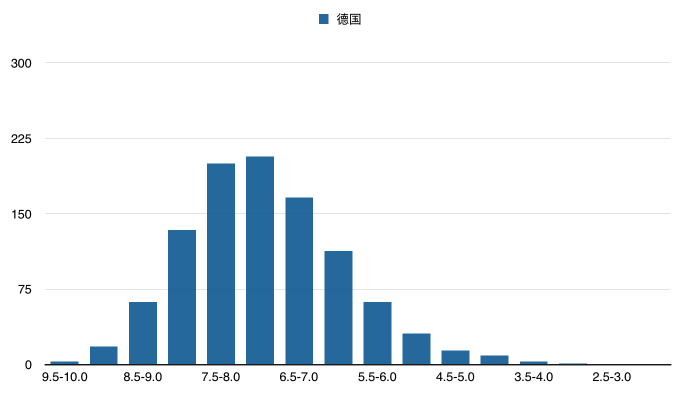
Germany
Total films: 1,344

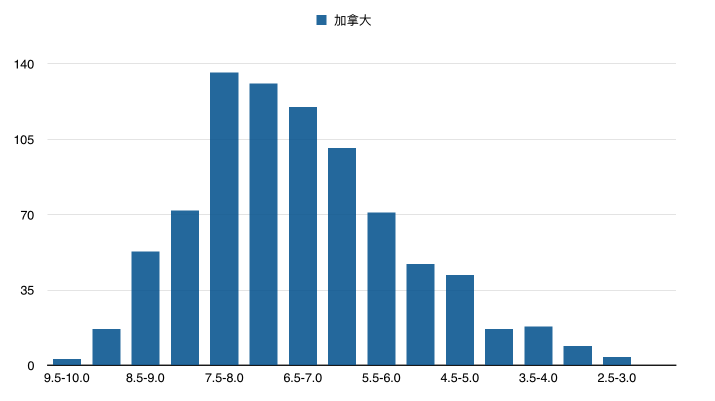
Canada
Total films: 1,054
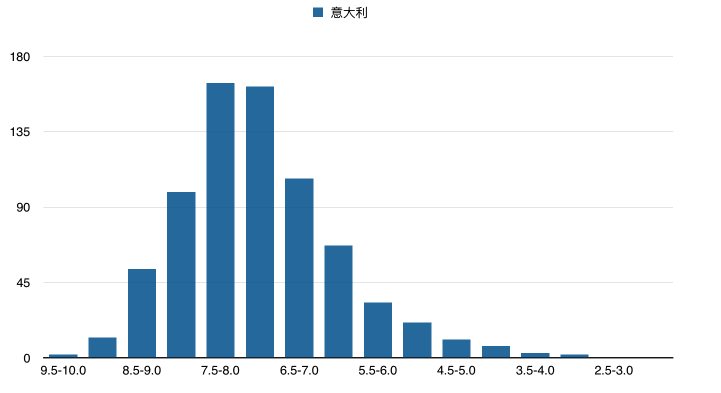
Italy
Total films: 1,073

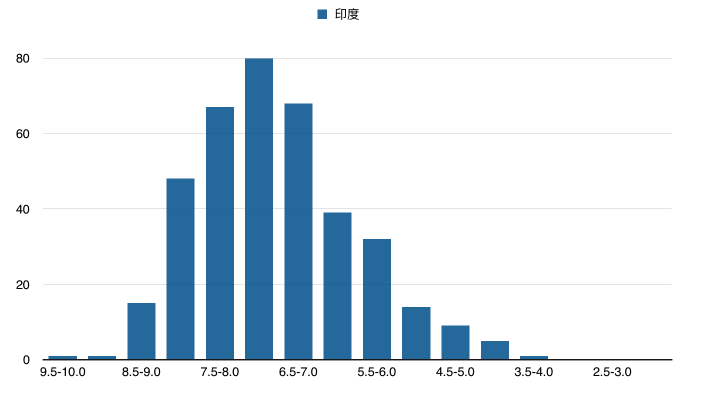
India
Total films: 548
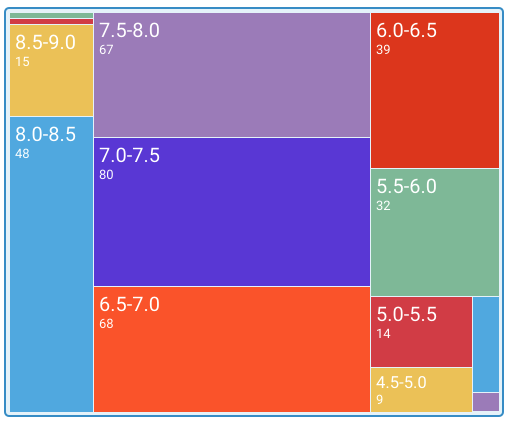
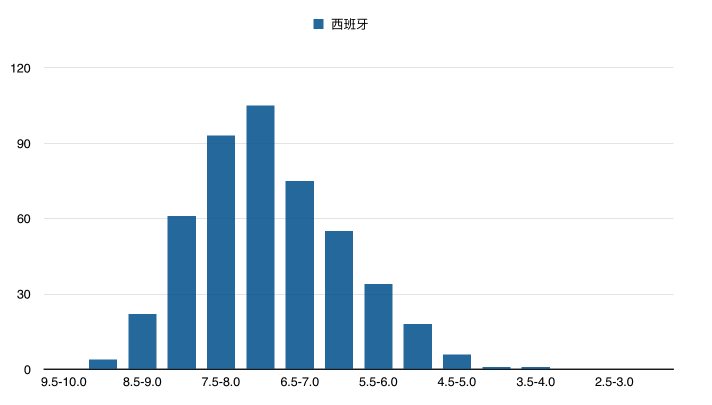
Spain
Total films: 669

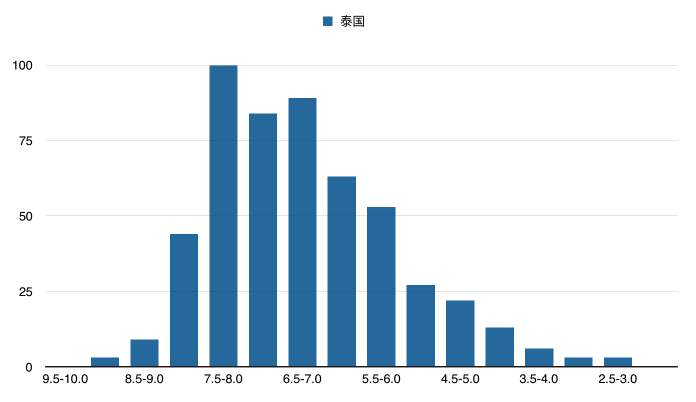
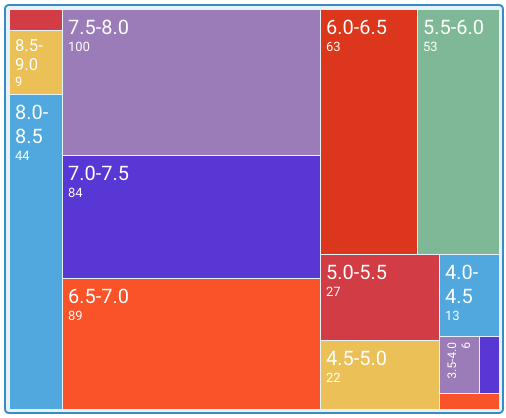
Thailand
Total films: 598
Australia
Total films: 454

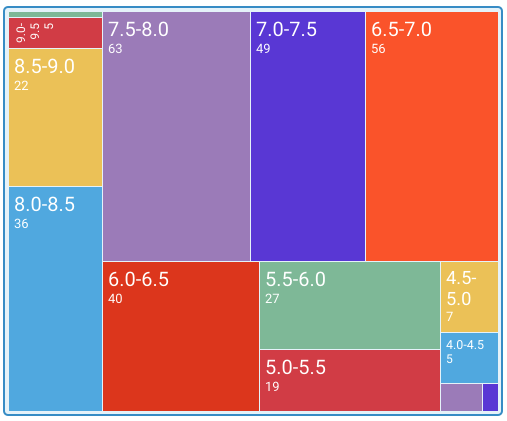
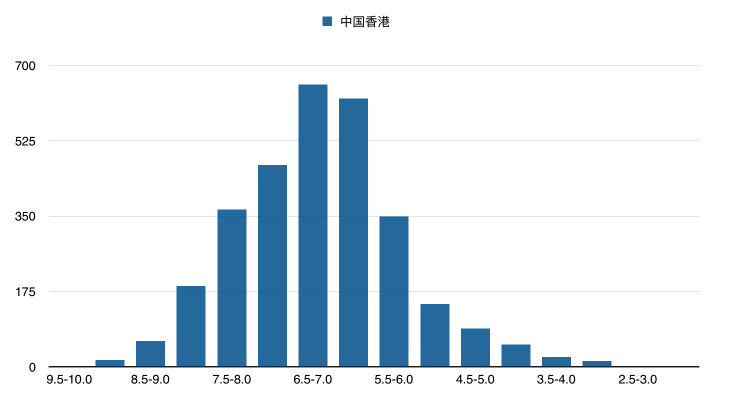
Hong Kong, China
Total films: 3,327
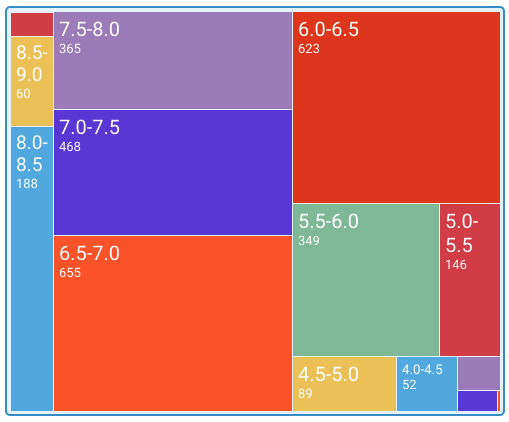
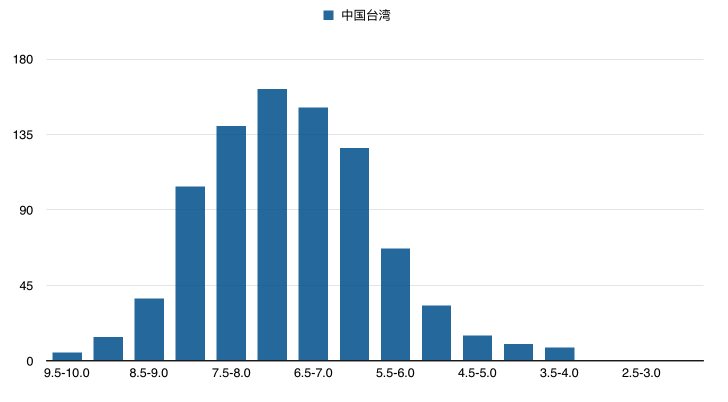
Taiwan, China
Total films: 1,036
Chinese Film Quality — Comparative Analysis
Now for the main event: how does Chinese cinema compare to other countries and regions? (No comparison, no pain.)
China vs. the United States
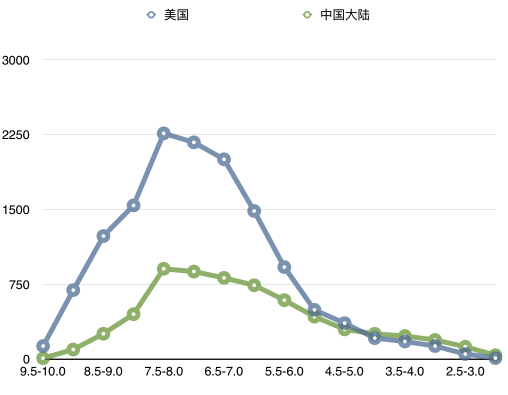
Looking at the US frequency line chart alone, nothing stands out beyond the volume difference — the two look roughly the same. What about the frequency-rate comparison?

For mid-tier films (6.5 and above), the US blue line is consistently higher than the Chinese green line. For below-average films, the blue line is consistently lower than the green — and by no small margin.
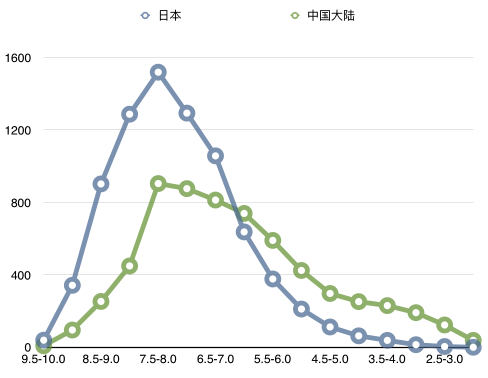
China vs. Japan
Japan’s film quality is high, and even the frequency comparison makes the gap obvious:
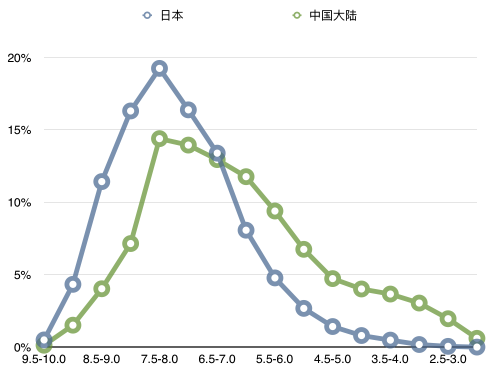
In the frequency-rate comparison, the crossover point shifts about 0.5 points to the left compared to the China-US chart, and the absolute distance between the two lines is much larger. If the China-US gap is “seeing their backs,” the China-Japan gap is “eating their dust.”
Mainland China vs. Hong Kong
Let’s compare mainland China and Hong Kong:
At first glance it looks pretty close…
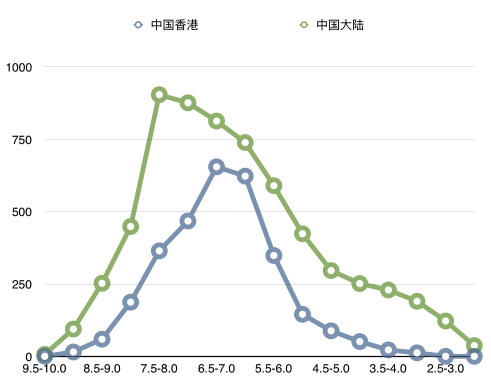
But that’s an illusion caused by the mainland’s larger total output. Once we switch to the frequency-rate view, things look very different:
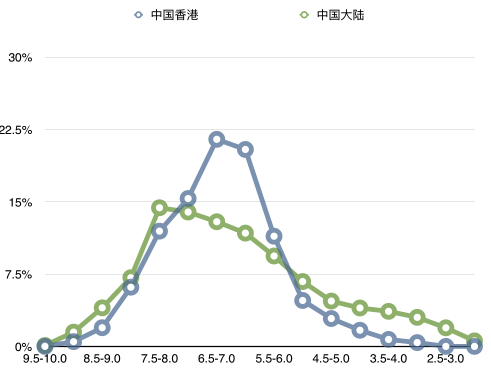
In producing genuinely good films, the two are roughly tied. In the mid-tier range, Hong Kong has a clear edge. In the bad-film department, the mainland continues to lead by a wide margin.
Film Quality by Year
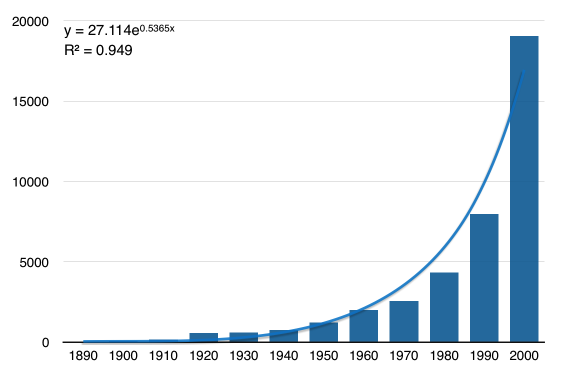
Films Produced per Decade
I tallied films by decade. The last bar looks shorter because only the first half of the 2010s had elapsed at the time of the dataset. Removing that bar, the remaining bars show roughly exponential growth — suggesting another 20,000 or so films will be produced in the five years following the data cutoff.


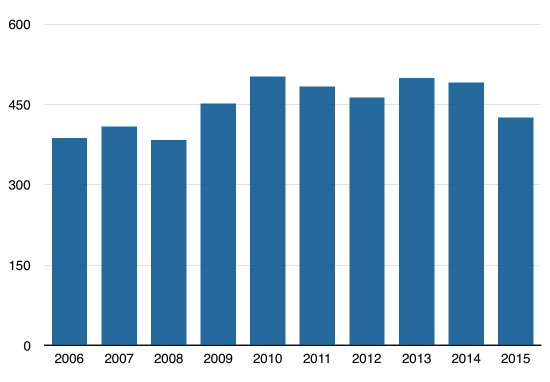
Annual Film Output, Last Ten Years
Output has been consistently high over the past decade.
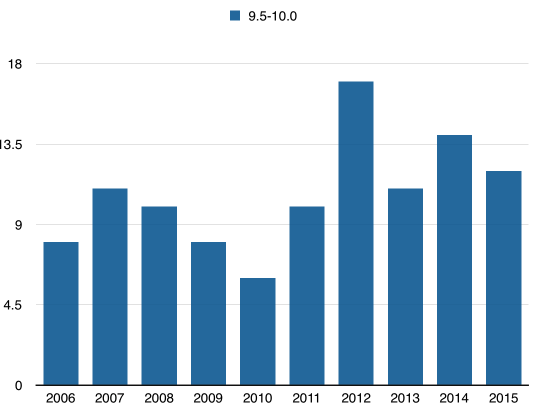
Films Rated 9.5 or Above, Last Ten Years
Masterpieces seem to appear somewhat randomly over the past decade — no discernible pattern.

Films Rated 8.0 or Above, Last Ten Years
Output of genuinely good films has stayed consistently high.
Films Rated Below 6.0, Last Ten Years
The number of bad films produced has actually been increasing year over year.
Afterword
Chinese cinema still has a long way to grow. So does world cinema.
Let good films multiply, and bad films dwindle.